
Four places your money leaks.
Results from a multi-location restaurant group, measured against their own earlier costs. Percentages only. Every figure comes from their purchasing records.
Lower build-out cost
Best of three new stores vs. the group's first-store benchmark. The other two came in 19.5% and 11.8% lower.Less food cost per sale
Food cost fell from 31.2% to 26.4% of sales in one store in a quarter. Produce sourcing alone ran about 25% cheaper.Lower packaging spend
A custom packaging program in 2024 vs. old unit prices. Bowls came in 46% lower and lids 27% lower.Lower central-kitchen labour
Twelve months year over year. Kitchen labour went from about 30% of sales to about 11%.
Build-outs, taken apart
Every layer is a line item.
We quote each layer of the build separately, so none of it gets bundled at list price.
Store totals are compared with the group's first-store benchmark. Fixtures are compared with supplier list price. The image is an illustration.
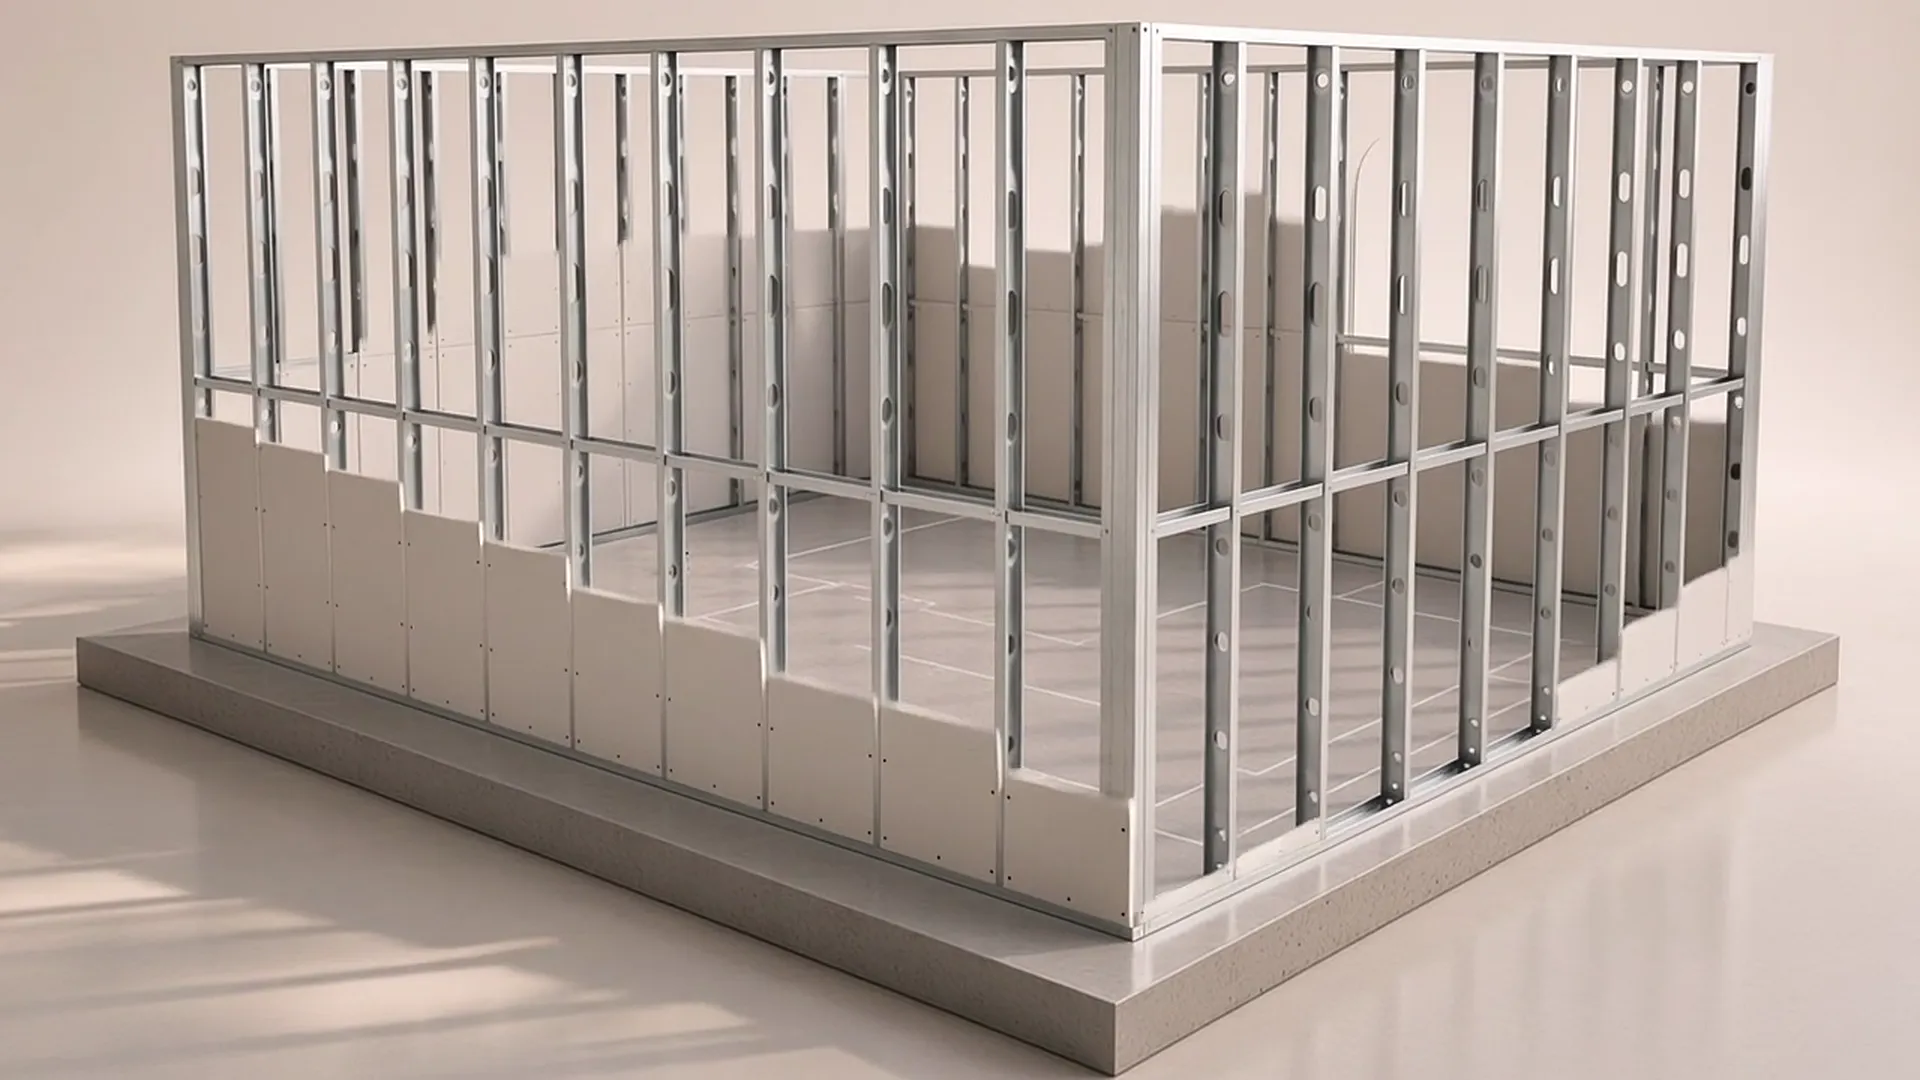
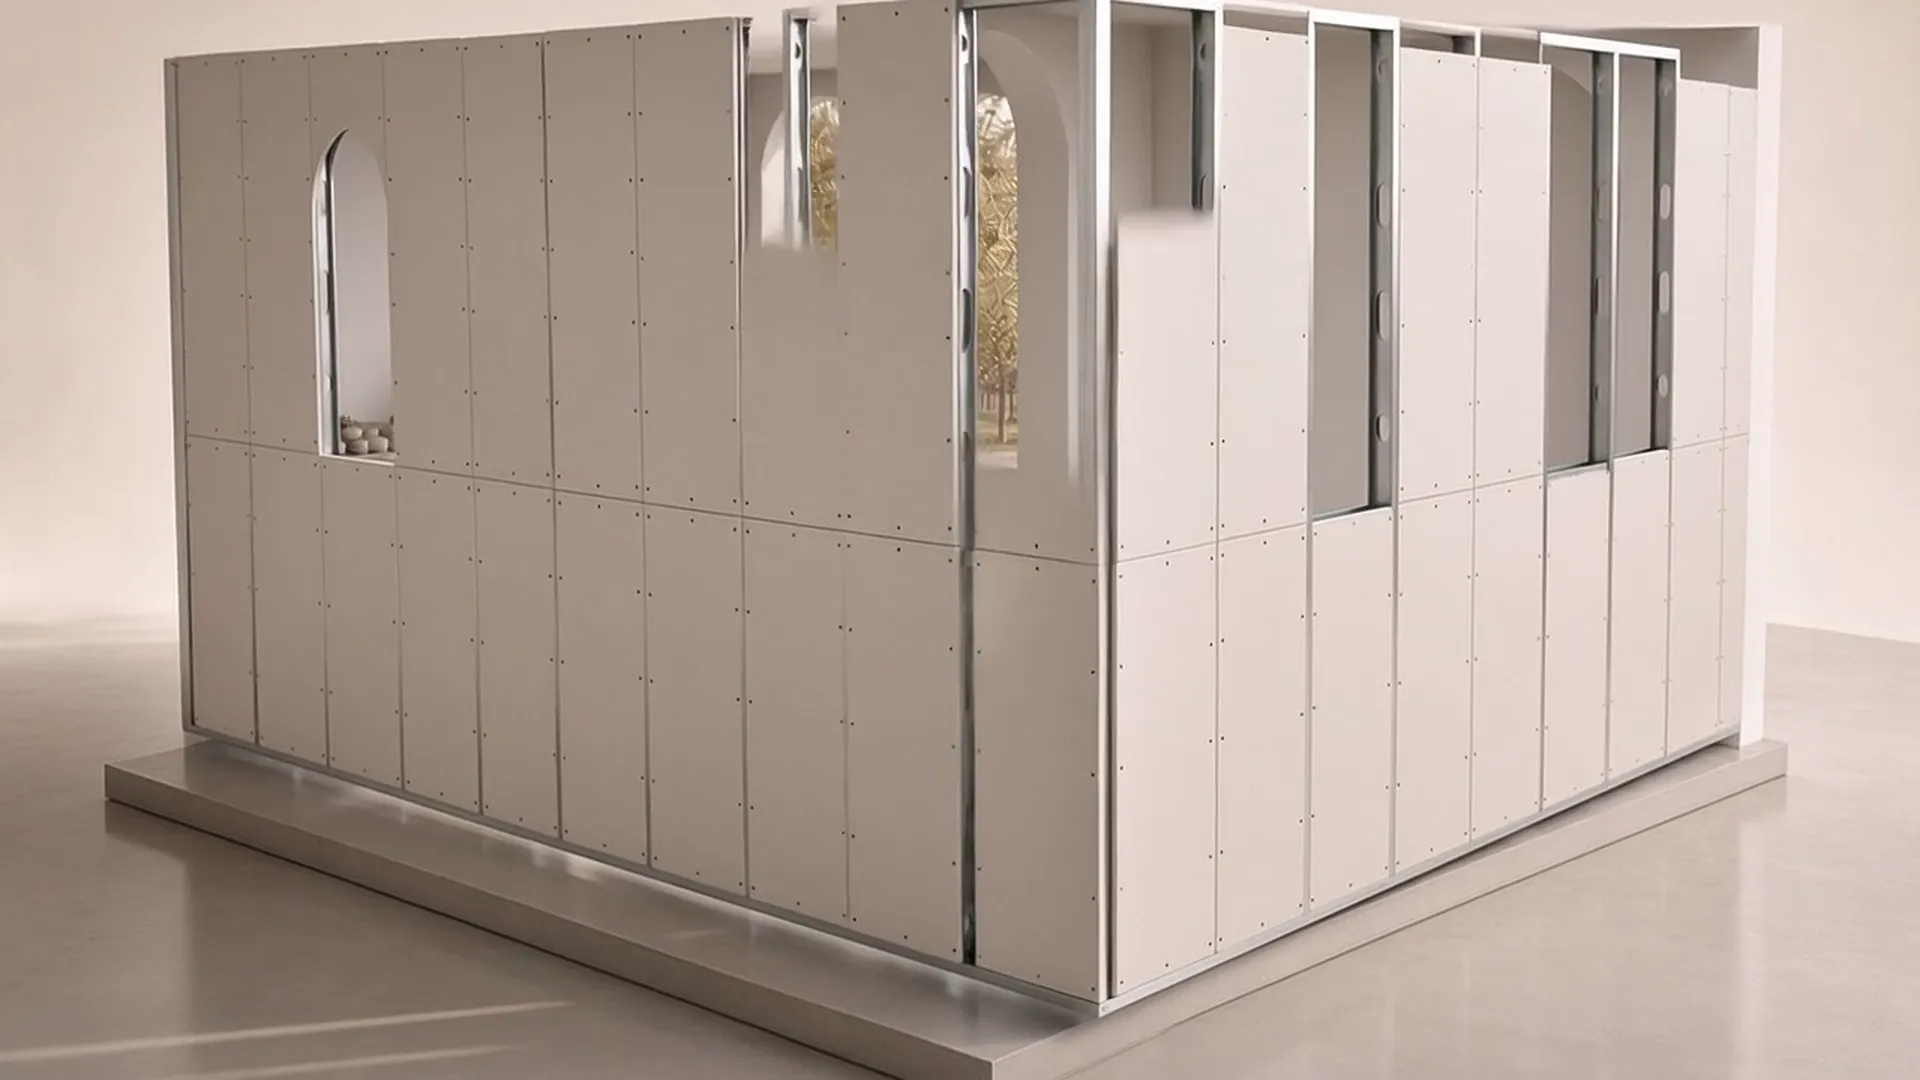
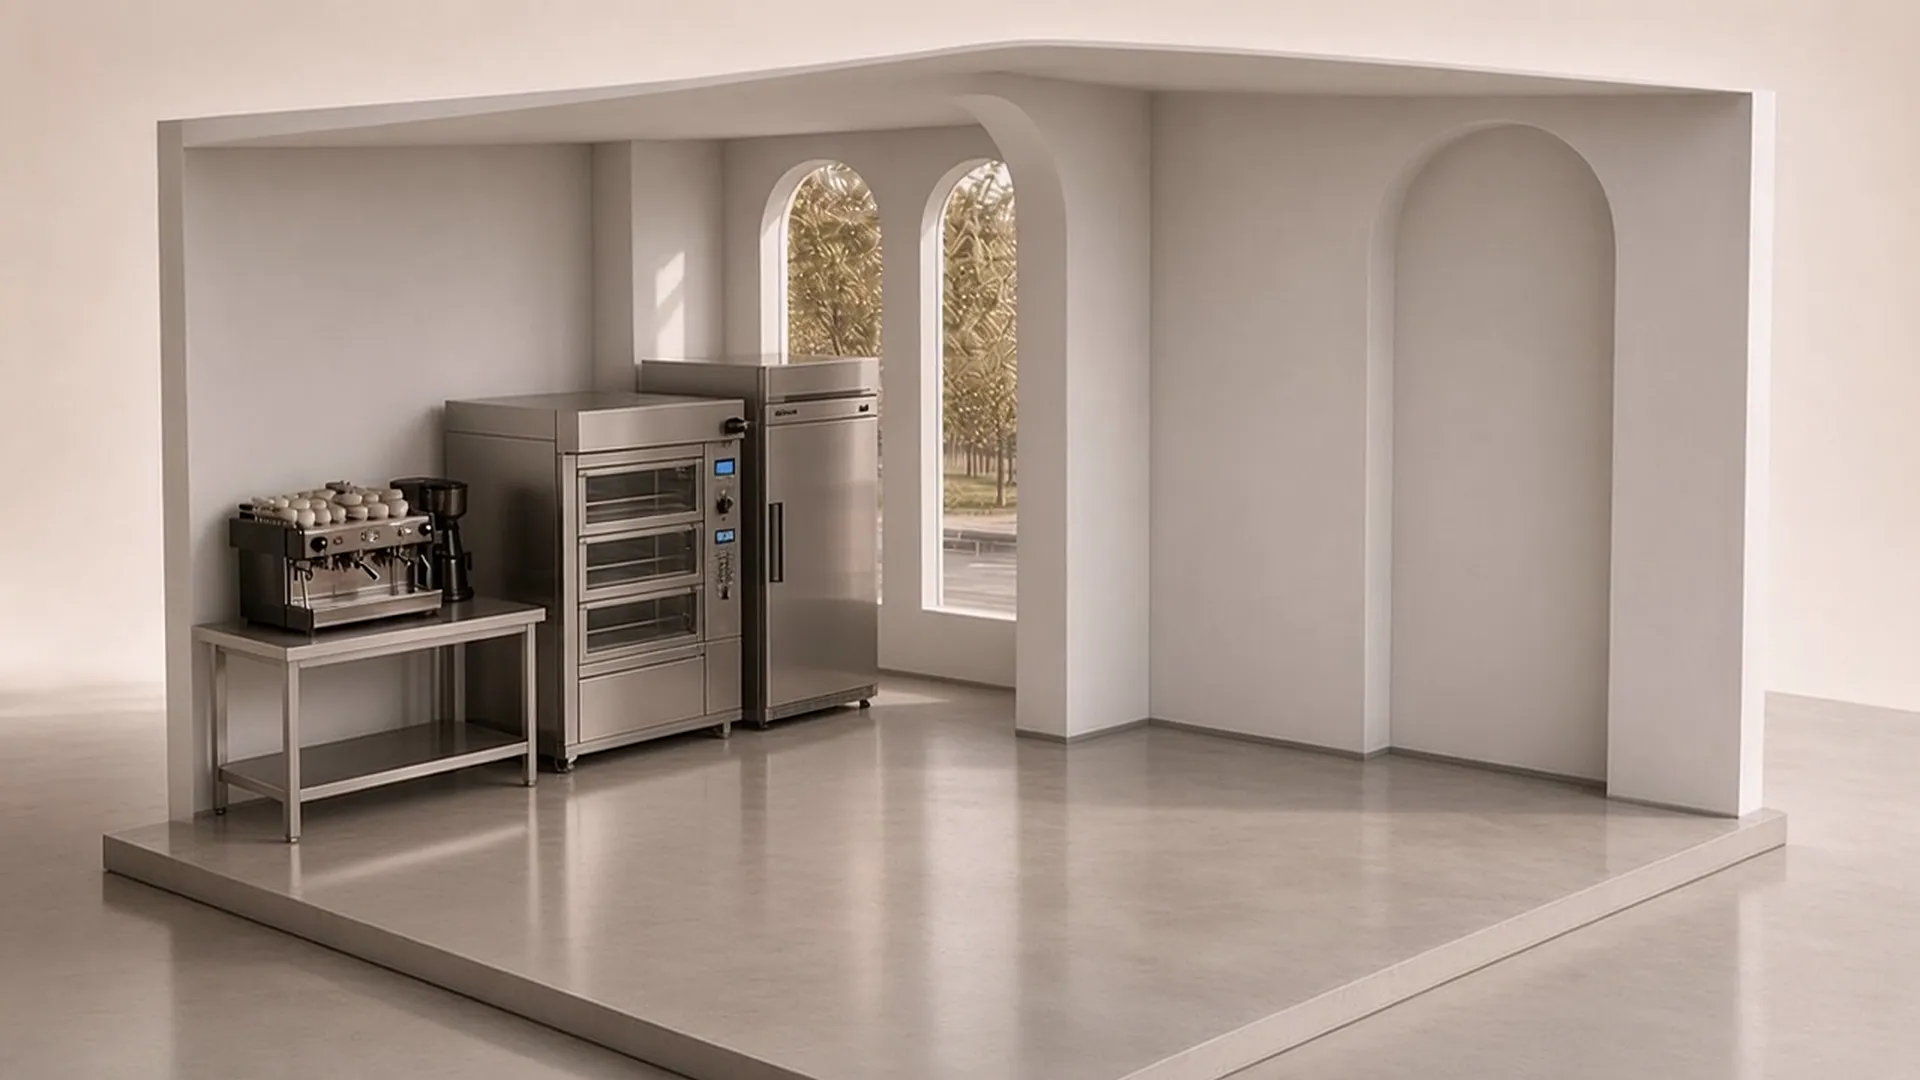
Watch a store come together.
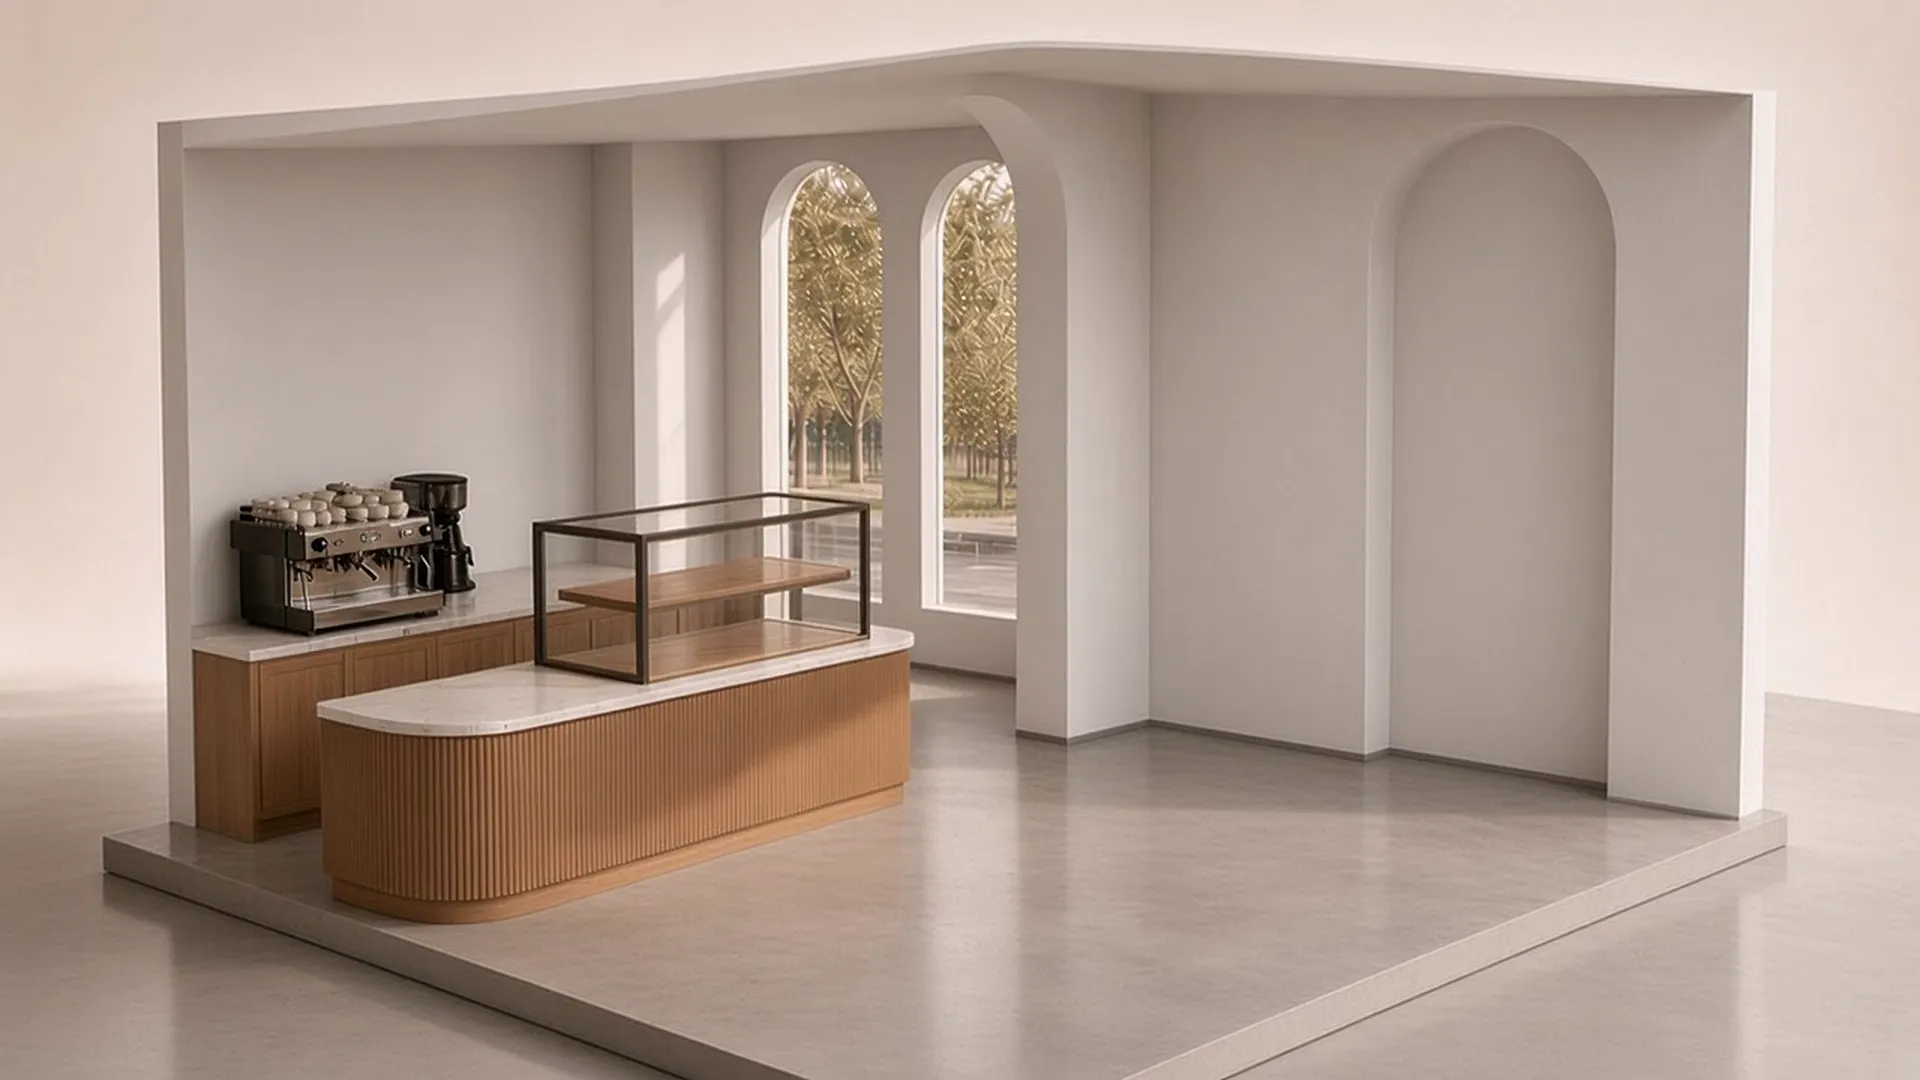
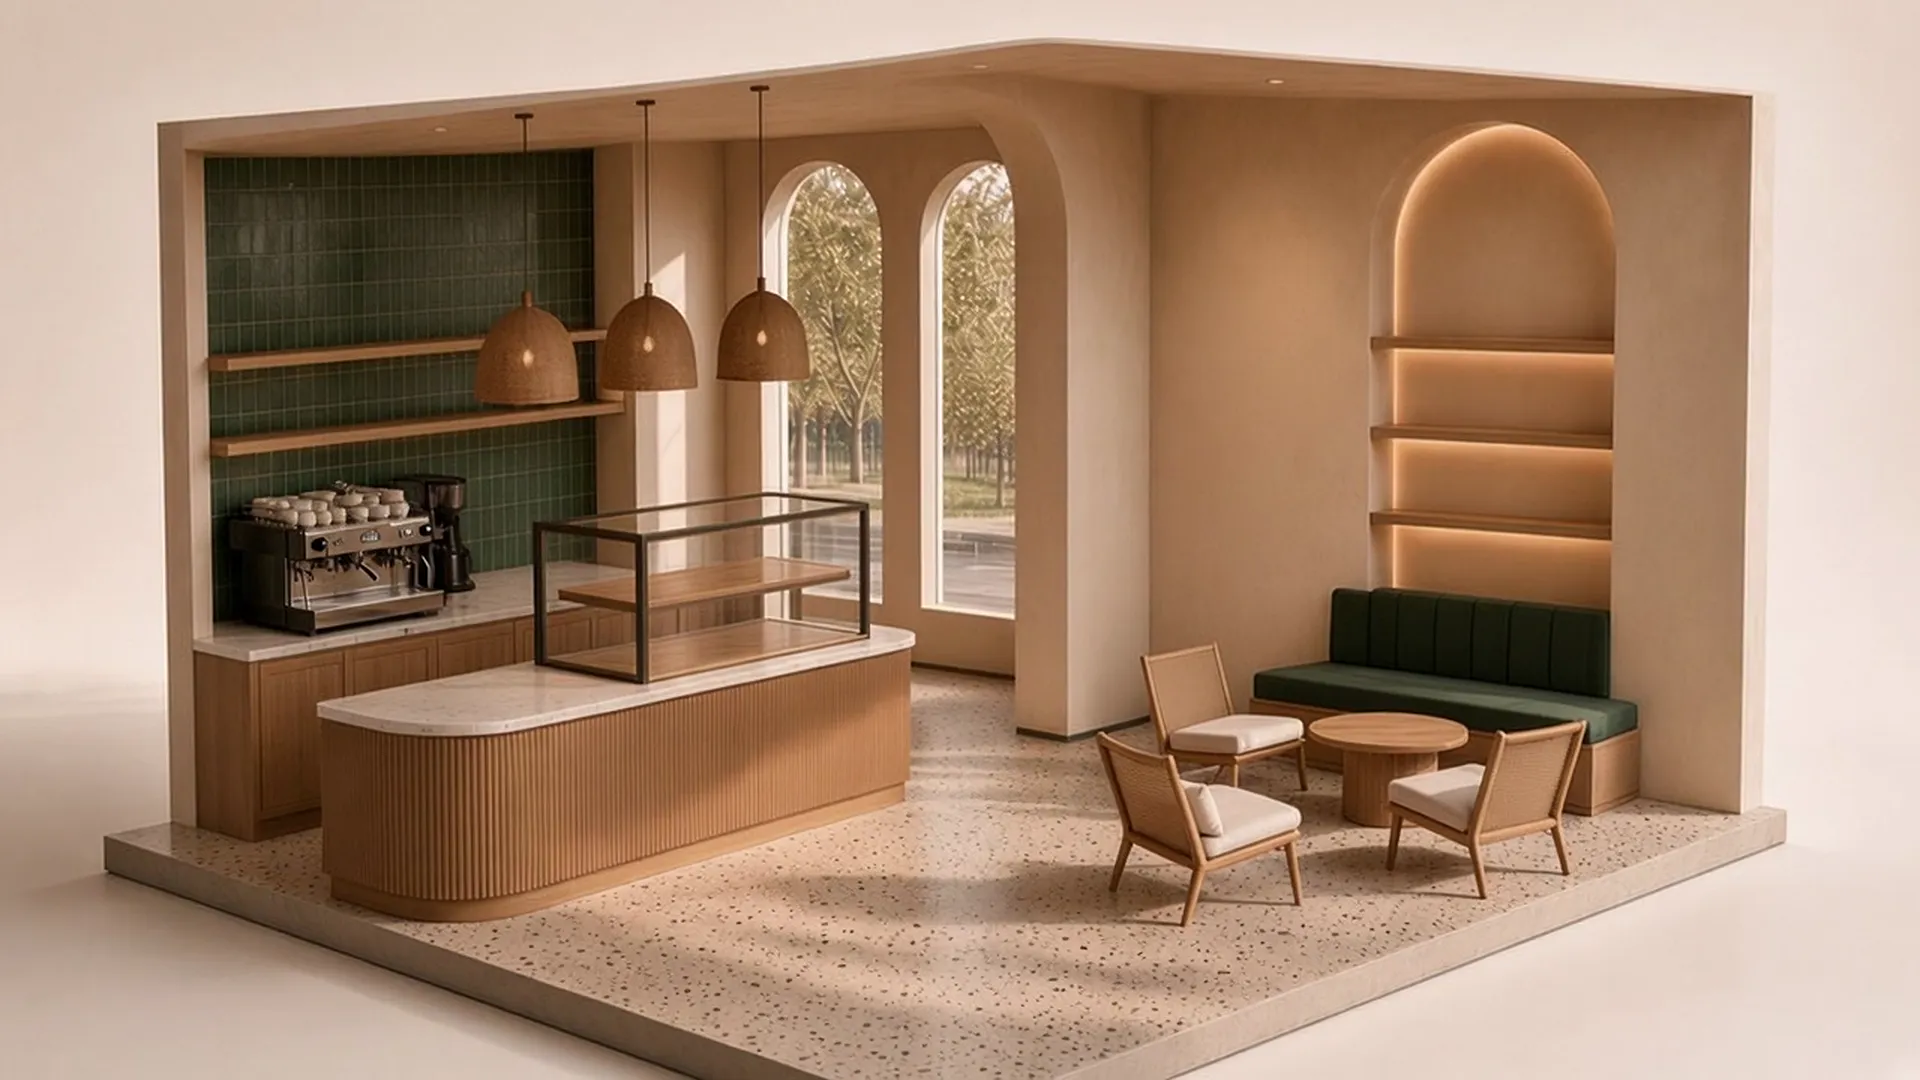
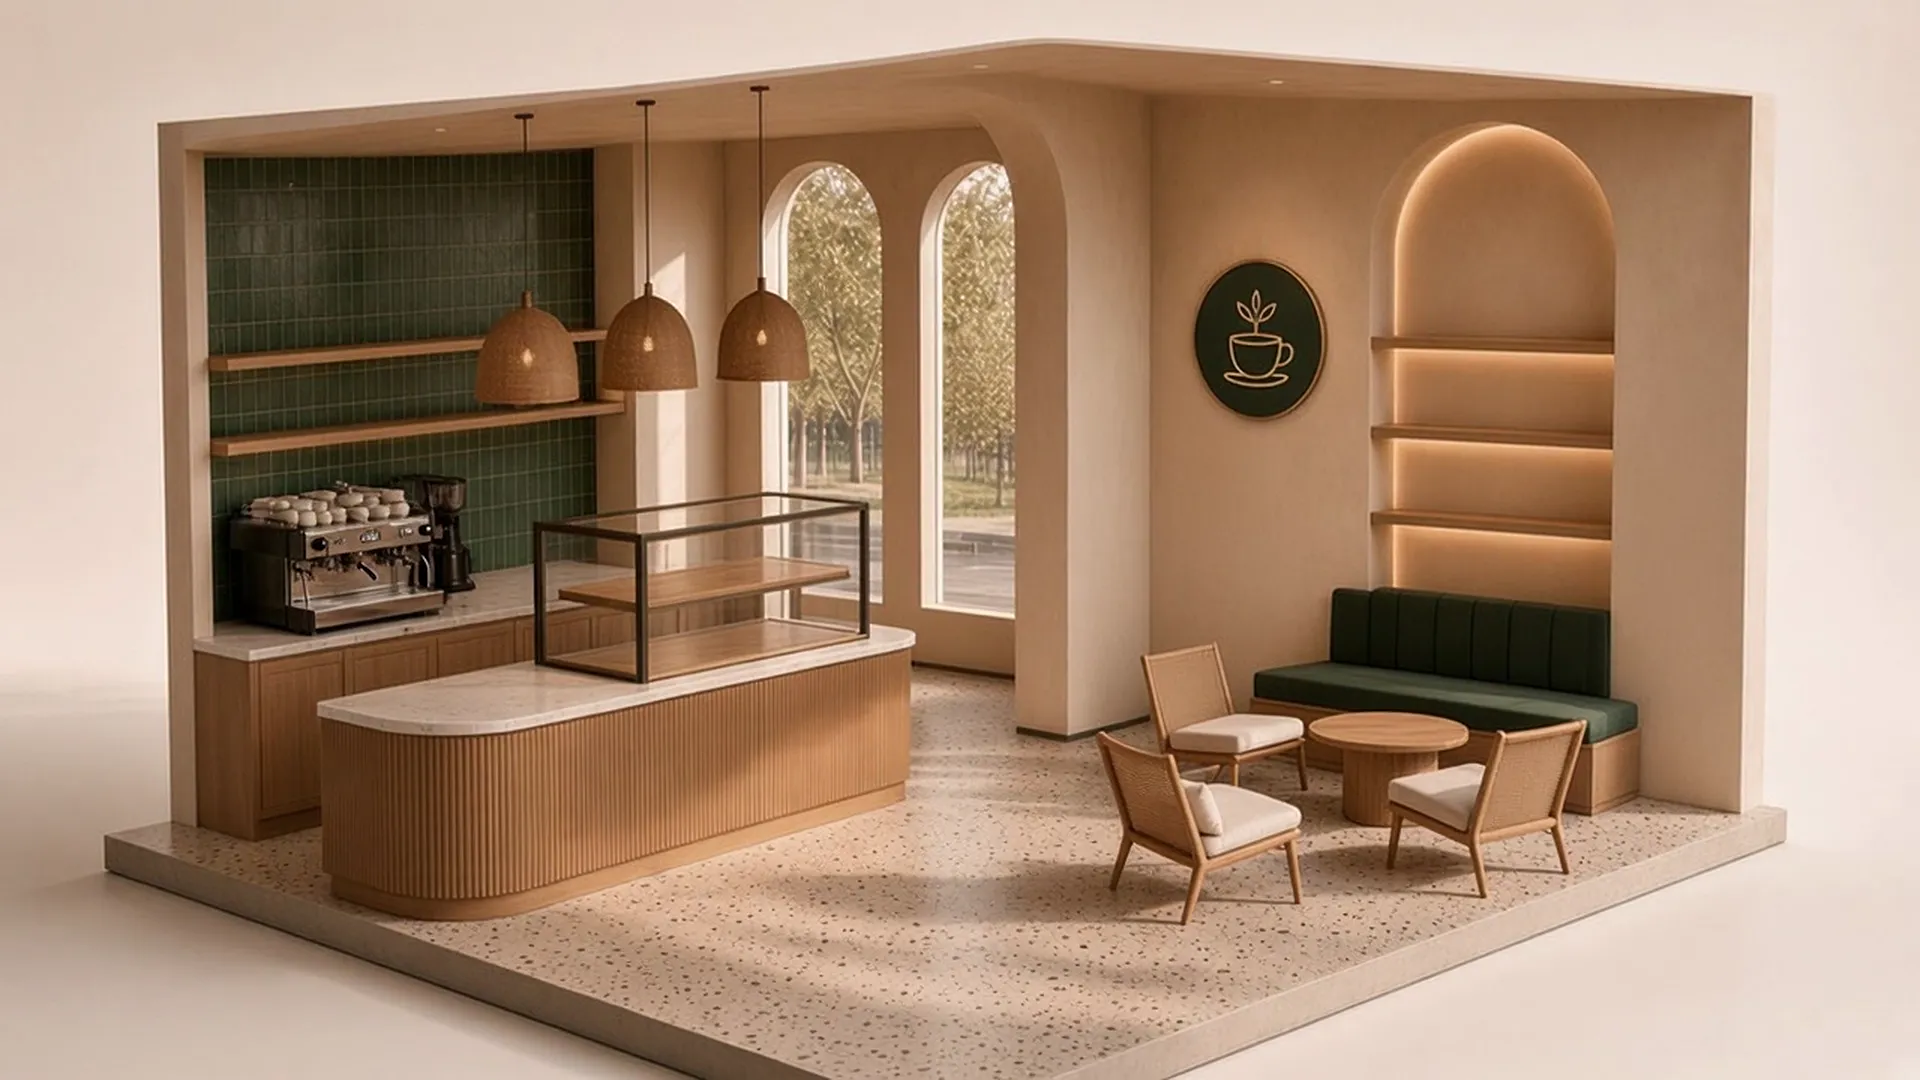
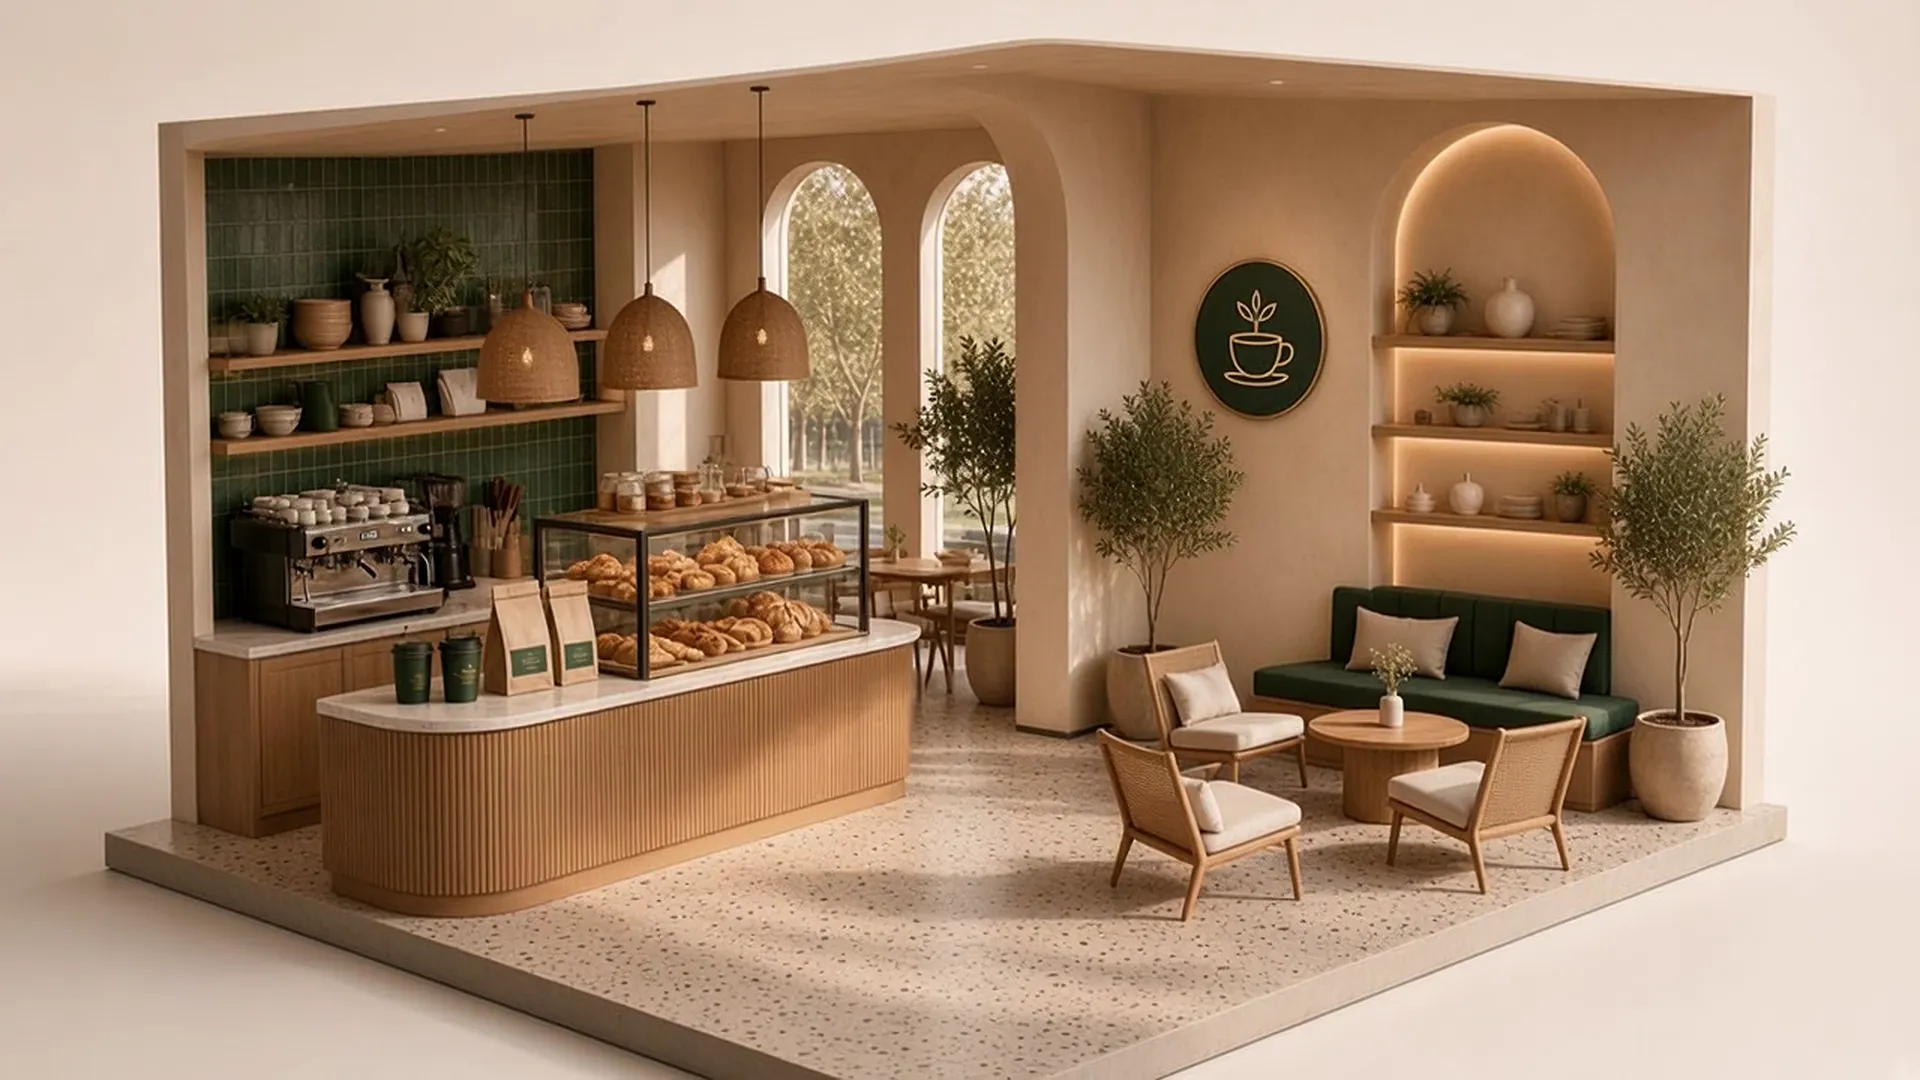
A rendering of a typical build, layer by layer. Each layer was bid out on its own, and the figures come from the group's real builds.
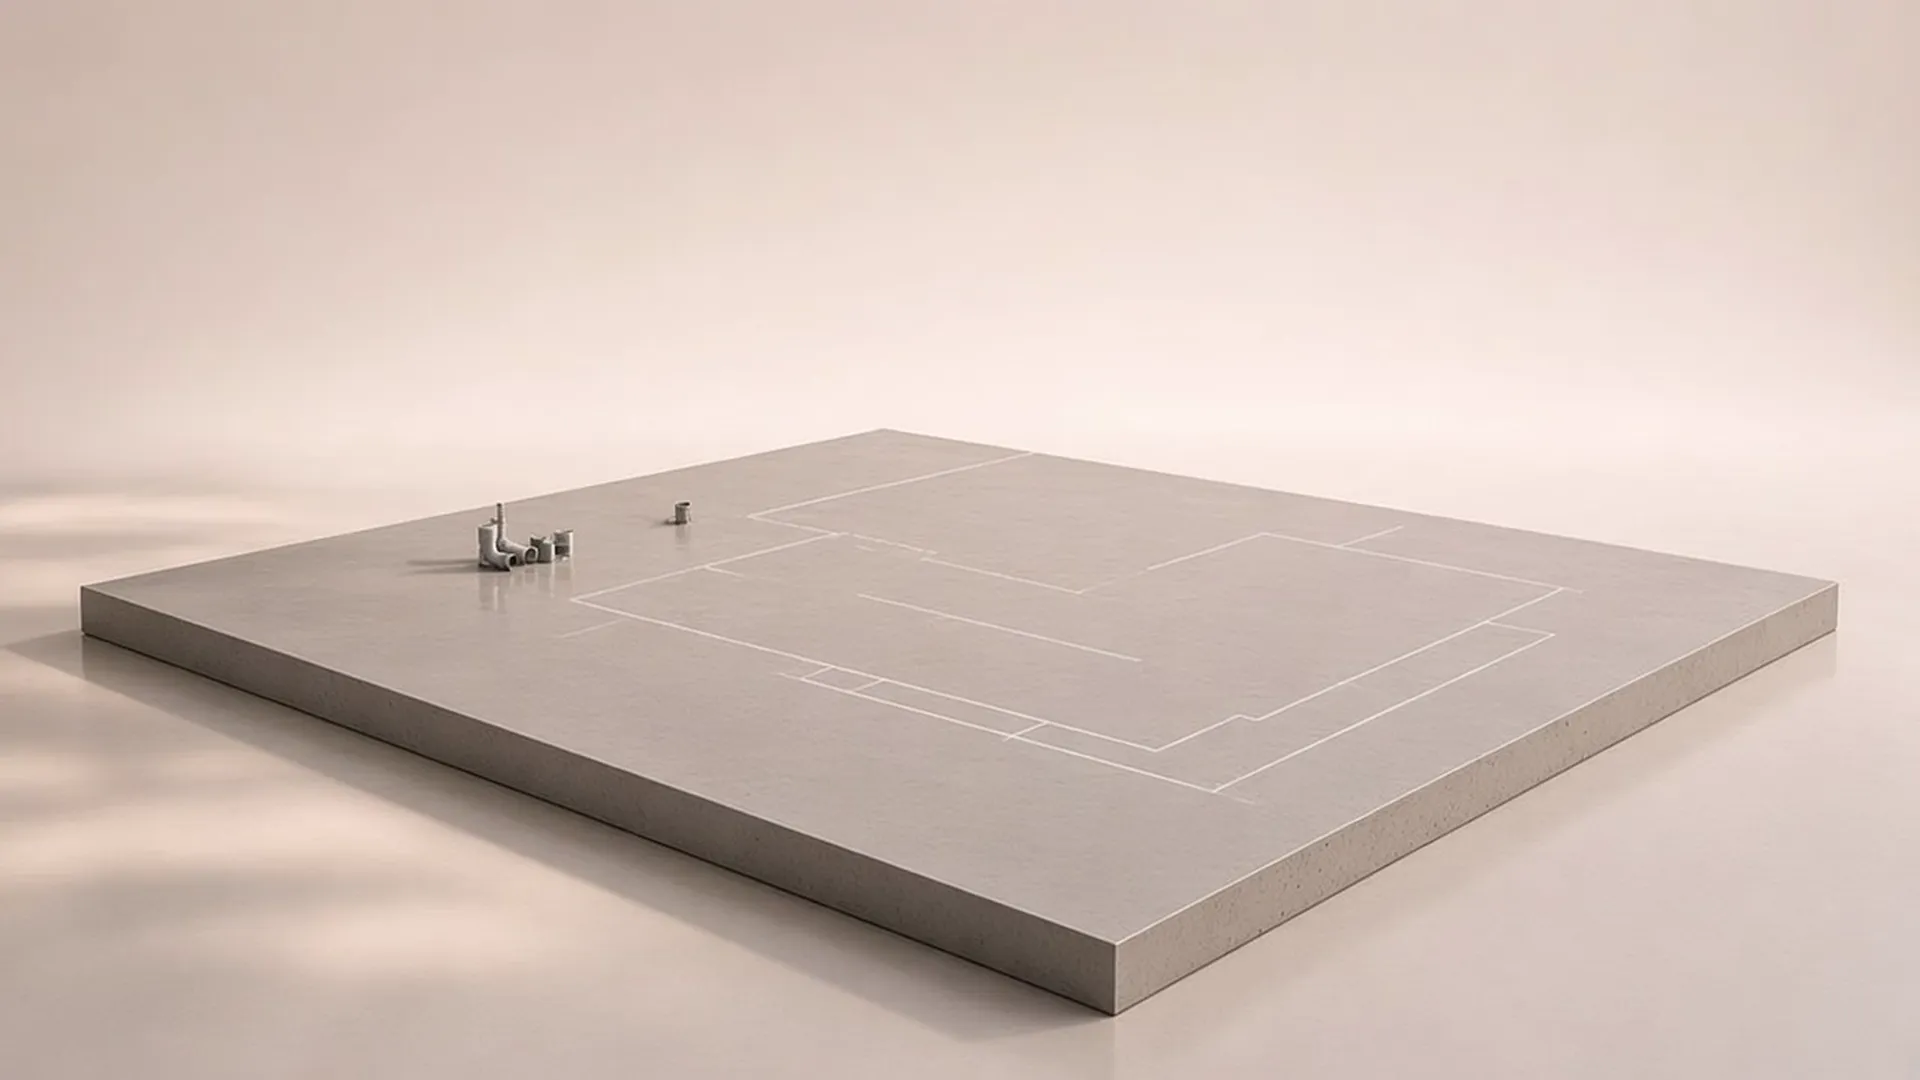
Bare slab
Survey, measure and plan the layout before anything is bought.
Rendering for illustration. Percentages are from the group's records.
How it works
Spend less. Invest the difference.
Audit
We go through your invoices, quotes and build budgets. We look at what you pay, not what you sell.
Re-source
We split bundles, bid out each layer, and go direct to makers for packaging, fixtures and produce.
Reinvest
The margin you get back pays for your next store, a better crew or better food.
Questions.
Do I need to change suppliers?
Not always. Sometimes the data is enough to renegotiate. Other times we bring in an alternative supplier and let them compete.
Is this only for restaurants?
The proof here comes from restaurants. The method works for any business that builds, stocks or ships.
Are the numbers real?
Yes. Every percentage comes from the group's own purchasing and build records, measured against their earlier costs.
What does a review involve?
One call, then a list of your top spend lines and a short report showing where the room is.
Start here